
Generating the coefficients for these filters is far and away the toughest part of filter design from a mathematical standpoint. The complexity of generating these coefficients is driven by the criteria for obtaining specific passband, stopband and ripple requirements. While a number of software programs are available to reduce this process to cookbook level, it is important to understand the principles and processess at work. A general observation of the filter structure shown in Figure 1, on the Digital Filter - General Form section, should bring to mind the basic convolution process. If one views the filter coefficients as a reverse ordering of the filters impulse response, then it becomes obvious that these filters are simply a discrete embodiment of the convolution of the filters impulse response against the incoming time domain signal. Thus one can view the algorithms for generating the coefficients simply as tools that generate an array of impulse response values whose Fourier Transform represents the desired filter function.
A derivation or detailed explanation of the mathematics for the various approaches will not be presented here. The reader is encouraged to review the text in reference [2] for specific detail and description of the mathematics for the described approaches.
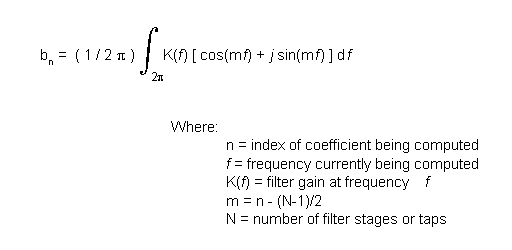
Three popular basic approaches for coefficient generation are employed by filter designers: the Fourier Series Method, the Frequency Sampling Method, and the Remez Exchange Method. The Fourier Series Method is based upon direct computation of Fourier series coefficients given a selection of desired start and stop frequencies. These coefficients are computed using the following equation:

Note that "m" is setup to compute only half the number of coefficients as there are taps. This is because the coefficients will be symmetric and will generate a symmetrical impulse response. For example, a 10 tap system will have the following arrangement:
| b0= b9 |
| b1= b8 |
| b2= b7 |
| b3= b6 |
| b4= b5 |
If an odd number of taps are specified then the system will be symmetric around the center most tap. For an 11 tap system this would mean b0 = b10 and b5 would be the only uniquely assigned value.
| 1. Specify the desired filter attenuation at each frequency, i.e. the K(f) coefficients |
| 2. Specify the number of taps or stages, N. |
| 3. Compute each coefficient per equation #1. |
Some iteration may be required to determine the appropriate number of taps based upon the resulting filter step response and/or its frequency response (obtained via an FFT or its impulse response).
Filters designed using Fourier Series Method tend to have linear phase characteristics. As with almost all filter implementations, the filter will exhibit undershoots and overshoots due to the Gibbs phenomena. This arises due to the finite structure of the digital computations as opposed to a continuous system. The impact of this effect may be reduced by a technique called "windowing". This invloves multiplying the coefficients by a series of coefficients designed to modify the frequency response in order to adjust for the finite aspect of the transforms taking place. While it is beyond the scope of this article to detail out these functions, it is recommended that the reference material be reviewed for information relating to the various window types: rectangular, triangle, Hanning, and Hamming. The primary tradeoff between each windowing technique is whether or not the application requires smoother frequency response for phase or magnitude.
Another technique used to generate coefficients is to utilize a discrete Fourier Transform. In this technique, the designer generates points that represent the desired frequency domain magnitude and phase response desired. The resulting data set is processed via a standard inverse discrete Fourier Transform. This produces impulse response values similar to the Series Method. These values are utilized in the same manner. The primary difference is that the designer must (or can) specify magnitude and phase in this technique. This technique is not recommended for those not familiar with Fourier Transforms and the effects of magnitude and phase point placement on the resulting transform. The choice of point placement can be quite important in this method and is one that can produce significant changes in results from subtle changes on the inputs.
The third technique is called the Remez Exchange Method. This algorithm utilizes inputs from the designer for start/stop frequency, allowed passband ripple, and minimum required stopband attenuation. The algorithm then attempts to find an optimal solution of coefficients to meet the given criteria. The mathematics of this algorithm are explained in a reasonably clear fashion in reference [2} and will not be covered here. A number of software packages are available that perform the necessary computations which make this approach attractive as an almost "cookbook" solution to generation of coefficients. Depending upon the specific implementation of this algorithm, the usual criteria coded into the algorithm produces Chebyshev filter approximations.
.
| Main Page - Introduction | |
| Digital Filters - General Form | |
| Additional Functions That Affect The Digital Filter | |
| Summary And References | |
| Digital Filter Program Download |
